
The Life Histories Collection: A Representative View of Race During the Great Depression?
Abstract
Out of work and out of money, writers of the 1930s gained a unique job opportunity thanks to President Roosevelt’s Federal Writers’ Project, which allowed them to go across the country researching the effect of the Depression on the nation’s citizens. Thanks to our university’s preservation of the Southern Historical Collection in the Wilson Library, we have firsthand access to the original copies of research recorded almost 100 years ago. This volume of interviews and photographs, known as the Life Histories Collection, sheds light on the lasting impact of slavery in the early 20th century and its permeation into education and employment. While the authenticity of this research—especially the interviews including ex-slaves—has been contested by scholars, the research presented in this paper upholds its accuracy. Data visualizations using Tableau Software illustrate the collected data from the interviews, and in doing so, reveal the racial disparities that separated blacks and whites in their access to higher education, better wages, and more opportunities.
Introduction
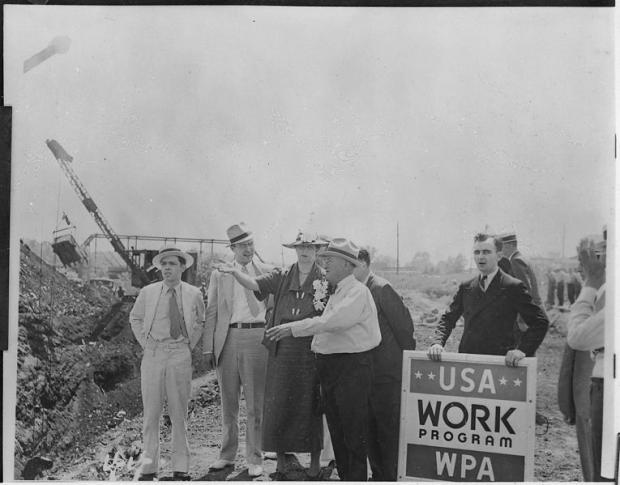
In 1935, President Franklin D. Roosevelt established the Federal Writers’ Project (FWP) under the Works Progress Administration (WPA) program of the New Deal (Pickett). The overarching goal of the FWP was to encourage the employment of writers and researchers during the Great Depression (Pickett). The project had many subprojects with one involving the collection of oral histories and photographs known as the Life Histories Collection (LHC). The LHC includes oral interviews from across the U.S., offering significant potential for insight into life during the Great Depression (Pickett). However, many scholars have questioned the validity of the LHC, especially in regard to African American life histories; one scholar, Thomas F. Soapes, notes that in ex-slave interviews, the interviewees were either volunteers or had a personal relationship with the interviewer, potentially influencing the authenticity and validity of the life histories (Soapes).
To determine whether or not the LHC is a reliable source for studying race during the Great Depression, digital humanities methods were used to transform and manipulate the data—a process that has never before been applied to this collection. Initially, I collected metadata from five African American life histories which I encoded using Sublime Text Editor (TEI/XML code) in order to make them searchable in the online database. I then created data visualizations analyzing the impact of race during the Great Depression through Tableau Software. Through the analysis of these visualizations, I maintain that the LHC accurately reflects the period of Jim Crow segregation and the disparate racial outcomes in access to education and job opportunities during the Great Depression.
Background
The FWP was created in response to the staggering unemployment rates of the Great Depression. The Great Depression officially began with the stock market crash of 1929, followed by an intense decline in economic activity (Granados & Roux). Though the life-altering effects of the Great Depression were felt by nearly all Americans with the exception of the most elite, no group of people was impacted greater than African Americans (Kaiser). Furthermore, African Americans had historically undergone additional hardship due to slavery and Jim Crow segregation, virtually eliminating the chance for any upward economic and social advancement (Woodard). This historical context of race in America will aid in the analysis of the validity of the LHC in terms of how well it represents the racial oppression during the Great Depression.
This project was made possible through access to the University of North Carolina’s Southern Historical Collection at the Louis Round Wilson Special Collections Library. Though online access is available to all, my colleagues and I had the opportunity to view the physical, original copies of the life histories. This collection contains approximately 1,200 life histories depicting the lives of those living through the worst economic disaster in our nation’s history (Pickett). Most importantly, the LHC was the first federally-funded project to take interest in documenting the lives of African Americans, many of whom were ex-slaves (Pickett); this suggests that the LHC has significant potential as a tool to study race in the context of the Great Depression.
Methods
The initial project involved working with five African American life histories from which I recorded metadata for further analysis. This metadata is contained in a shared spreadsheet where my colleagues also entered metadata from their chosen life histories. Some main categories within the spreadsheet include interviewee name, race, education level, and occupation category.
Figure 1. Screenshot of metadata spreadsheet displaying a few main categories.
Prior to visual analysis, the life histories were text encoded to make them searchable within the online archival database. This step was noteworthy given that this collection previously could not be accessed through a basic digital search. The encoding was completed using TEI Text Encoding in Sublime Text Editor, an XML coding language. This procedure involved much rhetorical decision-making; for instance, outdated racial terms were replaced with more contemporary and searchable words, thus reflecting the shifts in social norms in regard to race and the resultant changes in language. Importantly, the original versions of the life histories are still available in the online database alongside these contemporary versions, thus maintaining the historical integrity of the original texts while also establishing unprecedented access to searchable versions. The metadata collected was used to accurately fill in the basic information of the life histories for this encoding process.
The data visualizations were created through Tableau Software by uploading the metadata spreadsheet into the program. My visualizations analyze the relationship between interviewee race and education level as well as the relationship between interviewee race and occupation category. To create the visualizations, the appropriate variables were moved into either the “Columns Pane” or the “Rows Pane.” For my visualizations, the “Total Number of Records” variable is located in the rows pane, while “Interviewee 1 Race” and either “Interviewee 1 Education Level” or “Occupation Category” are located in the columns pane. Each visualization is color-coded for race, with pink representing white, blue representing black, and green representing biracial. Finally, the visualizations were modified to compare the percentages of each race out of the total number of records.
Visualization 1. The Relationship Between Interviewee Race and Education Level.
Visualization 1 demonstrates the interaction between race and education level among interviewees. Education levels of interviewees are located on the upper x-axis, and each education level is subdivided by the different races, located on the lower x-axis. The percentage of the total number of records is located on the y-axis. This visualization reveals that whites were overall more represented in every educational category (except the “none” category, in which there is a relatively even split reflecting all-around poor access to education during the Great Depression). As education level increases, percentages of black educational attainment decrease. Firstly, 24.3% of whites had a primary education compared to 9.9% of blacks. The same percentage of whites (12.6%) had a secondary or college education, while only 4.5% of blacks fell under secondary and 1.8% under college. This visualization reveals a significant difference in access to education among blacks and whites during the Great Depression, as blacks were significantly less likely to have primary, secondary, collegiate and vocational schooling.
Visualization 2. The Relationship Between Interviewee Race and Occupation Category.
Visualization 2 examines the connection between interviewee race and occupation category among interviewees. The occupation categories are shown along the upper x-axis, while the different races are shown along the lower x-axis. The percentage of the total number of records is located on the y-axis. This visualization shows significantly more employed whites across all categories, excluding “tenant farming” and “domestic.” The most prominent differences are seen in the categories of “student,” “artisan,” “public service,” “mill worker” and “other.” As such, this visualization reflects the uneven job opportunities available to blacks during the Great Depression.
Discussion
Education Level
Visualization 1 reveals that blacks had less access to education during the Great Depression, which is consistent with historical analysis. Overall, blacks did have less access to education than whites during the Great Depression (Margo). Due to segregation, not only were there far fewer schools for blacks, but black schools also received significantly less funding—a result of “public sector discrimination,” which emphasizes the influence of cultural prejudice in conjunction with tangible legal barriers (Margo). In 1930, 19.7% of blacks age 10 and up were illiterate, compared to 3.8% of whites (Margo). These statistics support the disproportionate access to basic education along racial lines, which is reflected by Visualization 1 in that only 9.9% of blacks had a primary education. Furthermore, school attendance was correlated with the literacy of the parents, and since the majority of black parents were illiterate, this correlated with low black school attendance (Margo). The most pronounced differences in education were at the high school level, with only 64 public schools for blacks across the entire South (Margo); this is consistent with the visualization since there exists an 8-point percentage difference between black and white interviewees with a secondary education.
Visualization 1 reflects consistently lower levels of black educated interviewees, demonstrating that the LHC accurately portrays the period of the Great Depression in regard to race and education. However, the data contained in Visualization 1 may actually over-represent the percentages of blacks who were educated since blacks had shorter school years and different grade levels (Margo). Furthermore, black schools often did not have grades, and very few offered secondary education programs (Davis). Clearly, blacks did not receive nearly the same quality of education as whites, and thus, the data from the period may overestimate blacks’ access to education.
The metadata collection may have also skewed the data, as subjective interpretations were made for each life history. In the life history of a black preacher named Preacher Goode; Goode stated, “I was educated in an old field school—they was no graded schools them days,” supporting the low quality of education available to blacks. He goes on to say that he finished school and was then educated by “several white men” whom he paid. Though Goode finished some sort of schooling, it was difficult to decide his education level since his school did not have grades and he received informal tutoring. Due to this subjectivity, education levels for blacks may have been misinterpreted.
Occupation
Visualization 2 demonstrates that blacks and whites had unequal opportunities when it came to jobs during the Great Depression, which is also supported through historical analysis. During this time period, blacks had far greater unemployment rates overall, with labor discrimination playing a large role, especially in unskilled work (Sundstrom); though the visualization displays that there were more unemployed white interviewees than black, the fact that blacks were highly underrepresented in unskilled work is supported by the visualization’s mill worker category—76.9% of mill workers interviewed were white. Even when controlling for urban and rural differences, blacks still faced much worse employment opportunities (Woodard). This economic hardship was worsened by the reemergence of white supremacist groups such as the Ku Klux Klan and the Black Shirts, who attacked and killed black workers for their jobs in positions previously deemed too inferior for white people (Hohenstein). Additionally, black wages were at least 30% lower than white wages on average (Sustar).
The above statistics indicate the racist ideology that permeated both the country’s legal system and cultural belief system, combining to create a nearly impenetrable barrier for black advancement within the job industry and, thus, within the country’s social hierarchy. Visualization 2 supports this notion in that there were no black interviewees who were students or artisans, indicating disparities in access to skilled specialties and education. Furthermore, there were far fewer blacks represented in the public service industry, likely due to the fact that doctors, lawyers and other professionals were included in this category. Since professional careers require higher education and blacks were denied equal access to education, they would appropriately be very underrepresented in this category. Finally, 85.7% of interviewees whose occupation fell under the “other” category were white—this may reflect the limited range of job sectors available to blacks due to discrimination and less access to education. Blacks were most represented in the areas of domestic work and tenant farming, jobs in which the common thread is servitude, reflecting the lasting cultural impact of the hierarchical system of slavery. Visualization 2 reflects this history of black subjugation, thus supporting that the LHC is representative of the racial inequalities in access to jobs during the Great Depression.
Conclusion
Based on my analysis, the LHC is, indeed, an extremely significant resource for studying race during the Great Depression. Though many have questioned the legitimacy of the LHC, my visualizations support that the LHC accurately represents racial disparities in education and job opportunities during the time. The interaction between lower education levels and less access to job opportunities created a system in which blacks were forced to remain in the lower ranks of society, and the LHC offers reliable firsthand accounts from the people living through this shameful yet incredibly important period in U.S. history.
Though my visualizations indicate the LHC as being representative of racial disparities in the impacts of the Great Depression, further research is necessary to analyze whether the data is undoubtedly accurate and reliable as a scholarly source for studying this time period. Additional analysis may examine other variables, such as how geographical limitations and the urban-rural divide interacted with race and education/occupation opportunities. With this further analysis, the LHC could serve as one of the most significant tools in the study of the history of race in America, an area that has objectively not been explored nearly enough.
Sources
Davis, Dr. Anita Price. “Public Schools in the Great Depression.” NCpedia. N.p., 2010. Web. 21 April 2017.
Granados, J. A. Tapia, and A. V. Diez Roux. “Life and death during the Great Depression.” Proceedings of the National Academy of Sciences 106.41 (2009): 17290-7295. Web. 20 Apr. 2017.
Hohenstein, Kurt. “Jim Crow.” Encyclopedia of African American Society. Ed. Gerald D. Jaynes. 2005. Web. 21 April 2017.
Kaiser, Wilson R., and Carlos E. Cortés. “Great Depression.” Multicultural America: A Multimedia Encyclopedia. Thousand Oaks: SAGE Publications, Inc., 2013. 988-92. Web. 20 Apr. 2017.
Margo, Robert A. “Race and schooling in the south, 1880-1950: An Economic History”. Chicago: U Chicago Press, 1994. Google Books. Web. 20 Apr. 2017.
Pickett, Carmelita. “Federal Writers’ Project.” Encyclopedia of African American Society. Ed. Gerald D. Jaynes. 2005. Web. 20 Apr. 2017.
Soapes, Thomas F. “The Federal Writers’ Project Slave Interviews: Useful Data or Misleading Source.” The Oral History Review 5.1 (1977): 33-38. Web. 20 Apr. 2017.
Sustar, Lee. “Blacks and the Great Depression.” SocialistWorker.org. International Socialist Organization, 28 June 2012. Web. 20 Apr. 2017.
Woodard, Laurie. “The Great Depression.” Encyclopedia of African American Society. Ed. Gerald D. Jaynes. 2005. Web. 22 April 2017.