Worsening Mental Health in College Freshman

Mental Health is a significant growing concern among adolescents. The Centers for Disease Control (CDC) defines mental health as “our emotional, psychological and social well-being.” It often affects how one handles stress, makes choices, and relates to others. Undergraduates are particularly vulnerable to worsening mental health. The most likely age group to have poor mental health is ages 15-24, which overlaps with what we consider traditional undergraduate ages 18-22 (Ajinkya). Oswalt found that an estimated 26% of Americans ages 18 and older live with a diagnosable mental health disorder. About 44% of students will also experience periods of severe distress: this includes depression, anxiety, panic attacks, and suicidal ideation (Oswalt et al.). Consequently, past surveys of self-reported levels of depression indicated levels from 17% to 53% of college students as the overall at-risk participants (Ajinkya). Despite these statistics, anxiety has surpassed depression as the most common mental health concern, now affecting 38% to 55% of students (Oswalt et al.).
Undergraduate students’ mental health problems affect their academic performance and personal development as they enter adulthood. A higher prevalence of depression in undergraduates has partially been attributed to several stressors: adjusting to college life, new environment/housing arrangement, academic pressure, interpersonal relationships, and financial strains (Ajinkya). Furthermore, social support and perfectionism contribute to the increase in stress among college students, leading to a decline in mental health. Social support refers to “the help provided by individuals who compromise the social network of a person who occupies the position of ego in this network” (Wang). Social support also alludes to the people you surround yourself with daily. High-quality social support among students is usually seen through the frequency of social contracts between family and friends (Wang). Perfectionism is defined as “the tendency to hold and pursue unrealistically high goals” (Nelson). Perfectionism leads to high-achieving tendencies in college students, and, therefore, becomes a negative stress inducer.
Depression and anxiety have been associated with decreased GPA, infectious illness, increased alcohol consumption, increased behavior risking self-injury, withdrawal from college, suicidal ideation, and in the worst cases, suicide (Oswalt et al.). The Mayo Clinic defines depression as, “mood disorder that causes persistent feelings of sadness and loss of interest.” It often affects how people feel and behave and can lead to various emotional and physical problems (Sawchuk). The American Psychological Association (APA) defines anxiety as “emotion characterized by feelings of tension, worried thought, and physical changes.” People diagnosed with an anxiety disorder suffer from recurring intrusive thoughts that cause them to avoid certain situations (APA). Anxiety is physically observed through symptoms such as sweating, trembling, dizziness, and an increased rapid heart rate (APA). It is vital to understand the difference between stress and anxiety. Stress can be defined as, “any type of change that causes physical, emotional, or psychological strain” (Scott). Unlike anxiety, these symptoms are often short-term and can cause people to utilize negative coping strategies.
By highlighting college students’ self-reported levels of depression, anxiety, social support, stress, alcohol consumption, and perfectionism, this study aims to discover the relationship between these factors and worsening mental health. Three hypotheses were created: Mental health has a significant relationship with social support factors, which are directly affected by the transition to college. Worsening mental health causes an increase in coping strategies such as substance use or the reverse. Increased perfectionism has a substantial correlation with worsening mental health, and that leads to one using negative coping strategies.
Methodology
Procedures and Sampling
A survey was conducted through Google Forms, which consisted of multiple mental health evaluations to measure stress, anxiety, depression, perfectionism, alcohol consumption, and social support. The form also included demographic questions such as gender, age, employment status, and ethnicity. Lastly, three questions in the survey were asked regarding mental health service usage. The form was sent out through multiple methods of communication: professors emailed first-year students the survey, posts on social media with a link, and lastly, a posted QR in popular student areas (e.g., libraries, dining hall). Collection occurred in October 2022. The survey received 115 responses. Participants were 78.1% female, 19.3% male, 1.8% non-binary, and .9 preferred not to specify their gender. This distribution is seen in Figure 1. Approximately 73.2% of the participants identified as white/Caucasian, 4.5% as Black/African American, 8.9% as Asian/Pacific Islander, 8.0% as Hispanic/Latino, 1.8% as Middle Eastern, and 3.6% as Multiracial.
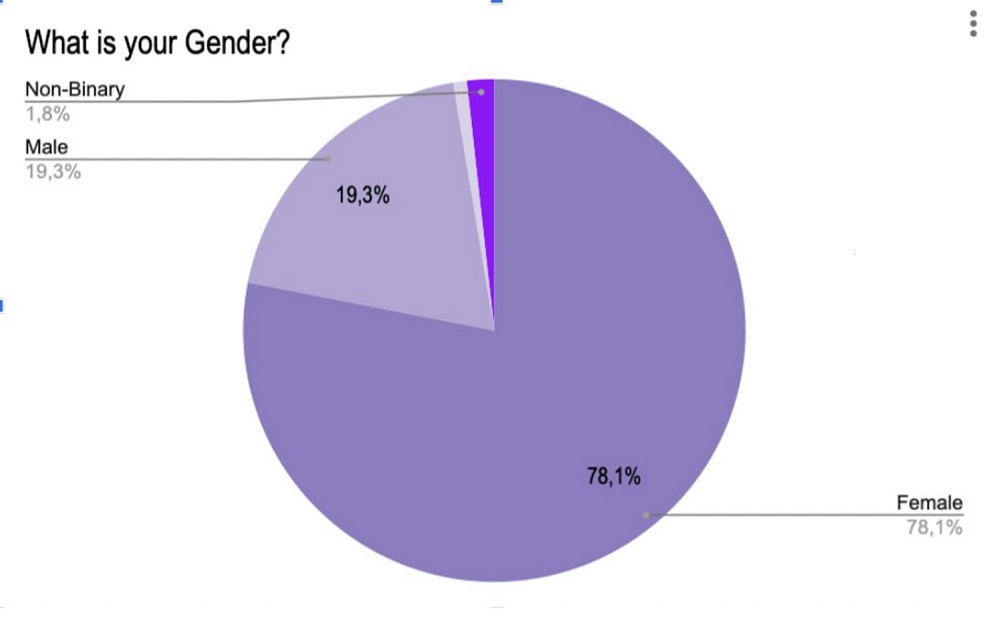
Figure 1: Gender Distribution
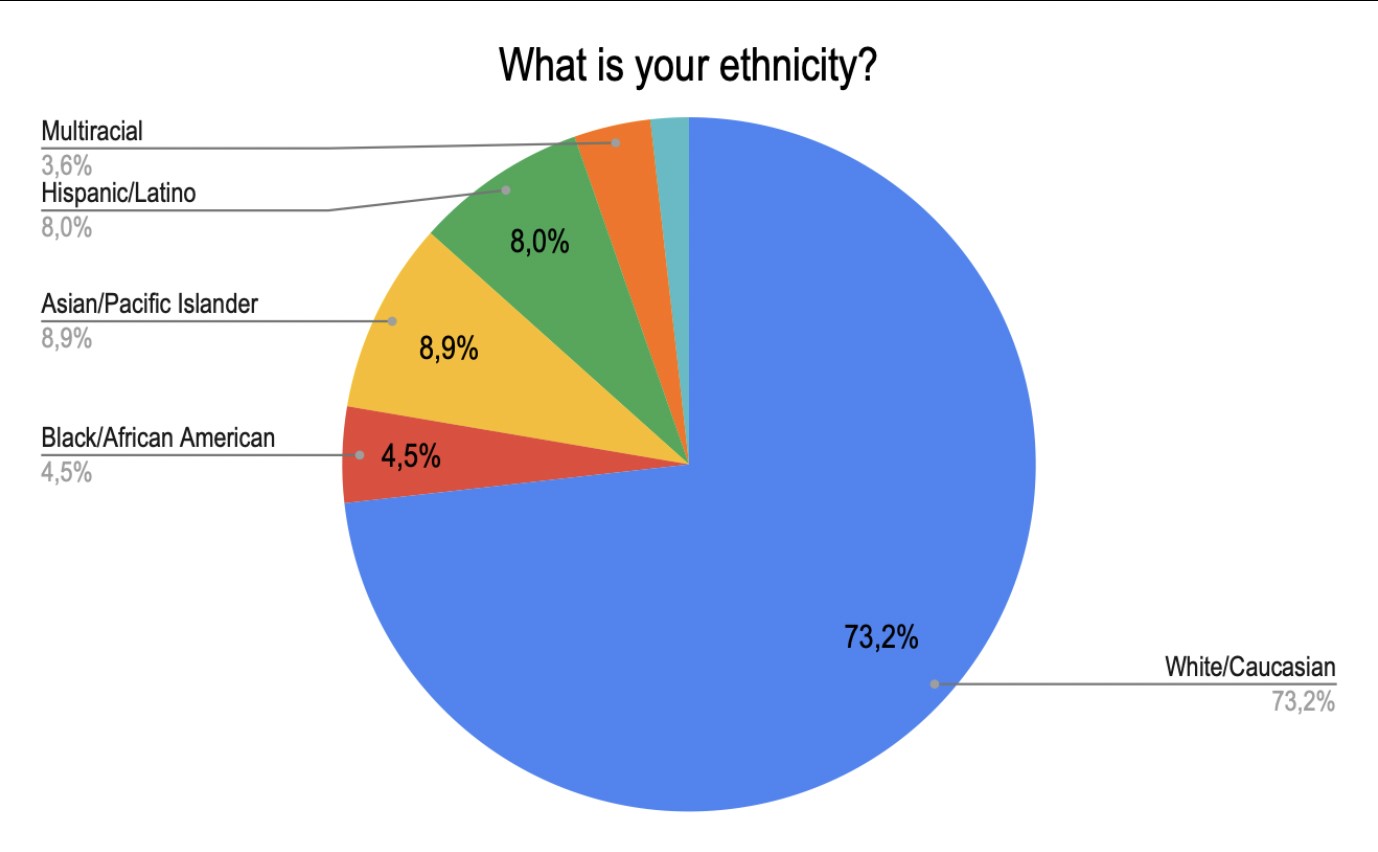
Figure 2: Ethnicity
Measures
Social Support
Social Support was measured by the Multidimensional Scale of Perceived Social Support (MSPSS). This evaluation consists of 12 Items with scores ranging from 1 (very strongly disagree) to 7 (very strongly agree). It evaluates social support from three sources, family (questions 3,4,8, & 11), friends (questions 6,7,9, & 12), and significant others (questions 1,2,5, & 10). Scores 12-35 indicated low perceived support, 36-60 medium perceived support, and 61-84 high perceived support. The MSPSS has been clinically validated through previous studies and seen consistency for both full-scales and subscales.
Anxiety
Anxiety was measured by the Generalized Anxiety Disorder Questionnaire (GAD-7). This questionnaire is a seven-item clinical evaluation to screen for generalized anxiety disorder. Scores range from 0 (not at all) to 3 (every day). Scores 0-4 suggest minimal anxiety, 5-9 mild anxiety, 10-14 moderate anxiety, and 15-21 severe anxiety. Scores above 10 are considered generalized anxiety. This measure has been validated and used to measure anxiety among general participants.
Stress
Stress was measured using the Perceived Stress Scale (PSS). This tool is a classic stress assessment that is popularly used to analyze how different situations affect feelings and perceived stress. Scoring ranges from 0 (never) to 4 (very often). Items 4, 5, 7, and 8 are reversed scored. The reverse score is 0 would be scored as 4, and 4 would be scored as 0. Scores ranging from 0-13 would be considered low stress, 14-26 would be regarded as moderate stress, and 27-40 would be considered high perceived stress. This scale has been validated through many studies and used in many clinical settings.
Depression
Depression was measured by the Center for Epidemiological Studies Depression Scale (CES-D), a 20-item scale that measures symptoms of depression in the past two weeks. Scoring ranges from 0 (Rarely or none of the time, <1 day) to 3 (Most or all the time, 5-7 days). A score below 15 indicated that the participant does not appear to be experiencing high levels of depressive symptoms at the current moment. Scores between 16-21 indicate mild to moderate depression, and scores over 21 suggest the possibility of Major Depression. These evaluative tools are designed explicitly for epidemiological research within a general participant sample.
Alcohol Consumption
Alcohol Consumption was measured using the Alcohol Use AUDIT Scale (Self-Report Version). The scale is a 10-item screening tool developed by the World Health Organization (WHO) relating to one’s alcohol consumption, behaviors regarding alcohol, and alcohol-related problems within the past year. Scoring ranged from 0 (Never, no) to 4 (Daily or Almost Daily; Yes, during the last year). A score of 8 or higher on this evaluation is indicative of risky or hazardous or harmful alcohol use. The AUDIT has been validated through previous studies for use in various genders and ethnic groups and is suited for an evaluative setting.
Perfectionism
Perfectionism was measured using the Almost Perfect Scale–Revised Scale (APS-R). This evaluative tool consists of 23 Likert-type items that range from 1 (strongly disagree) to 7 (strongly agree). This scale has been clinically validated and demonstrated good consistency among college students. The scale defines perfectionism in three discrepancies: perfectionism on the standard scale (questions 1,5,8,12,14,18,22), perfectionism on the order scale (questions 2,4,7,10), and perfectionism on the discrepancy scale (questions 3, 6, 9,11,15 16,17,19,20,21) with a score ranges on questions #1 and #3 measuring maladaptive perfectionism. However, it was not necessary to evaluate maladaptive perfectionism in this study.
Data Analysis
To analyze the results from the Google Forms Survey, all the data and responses were transferred into a Google Sheet. The results for each measure of data (depression, anxiety, etc.) were transferred into their own tab, allowing them to be analyzed. Lastly, the demographics were separated into a tab and analyzed. No further implications were recognized, and no participants were disclosed from the results.
Results
Social Support
Figure 3 reports the results for the cumulative scores of social supports on the (MSPSS). Each participant’s results were calculated and entered to match the correlating score range. Of the responses, 1.8% had scores between 12-35 that indicated low social support. 34.2% of the participants had scores between 36-60 that indicated medium social support, and 64% had scores between 61-84 that indicated high perceived social support.
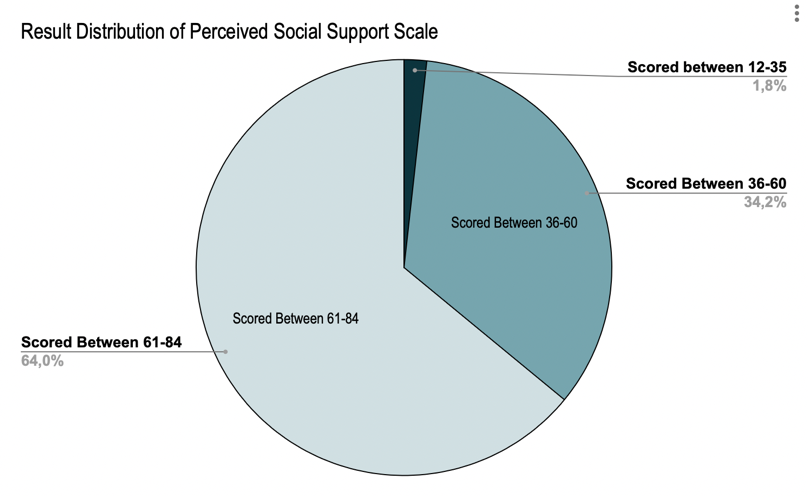
Figure 3: Cumulative Scores for the MSPSS
These results indicate that most participants were perceived to have high social support, while the second largest group was perceived to have medium social support. These results proved significant compared to other tools and coping mechanisms due to the positive outlook of support that surrounded most participants.
Anxiety
Figure 4 reports the results for the cumulative scores on the GAD-7. Each participant’s results were calculated and entered to match the correlating score range. Of the received responses, 19.3% of the participants scored within a range of 0-4, indicating minimal anxiety; 22.8% scored within a range of 5-9, indicating mild anxiety; 28.9% scored within a range of 10-14, indicating moderate anxiety, and 28.9% scored within a range indicating severe anxiety.
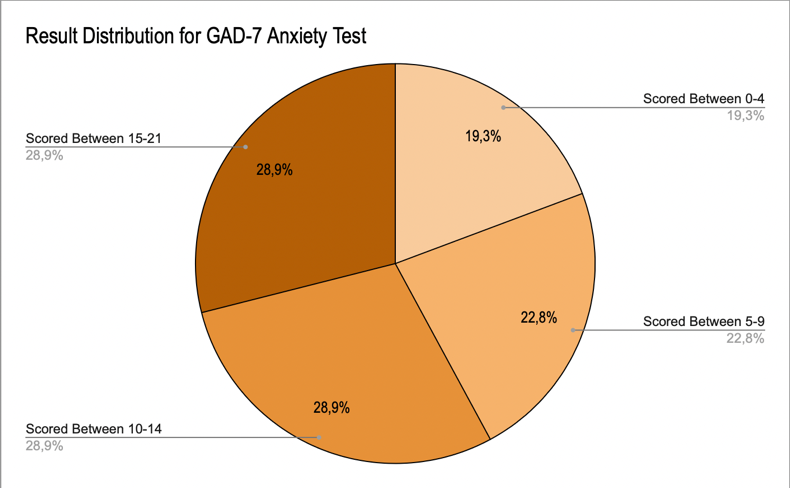
Figure 4: GAD-7 Results Distribution
We see that over 25% of the students’ scores showed severe anxiety, and over 25% of the students’ scores showed moderate anxiety. Therefore, over half the sample participants reported having at least moderate anxiety. This figure is significant as moderate anxiety is proven to have negative health impacts.
Stress
Figure 5 reports the cumulative scores on the (PSS). Each participant’s results were calculated and entered to match the correlating score range. Of the responses received, 16.7% of the participants scored between 0-13, indicating low stress; 19.3% scored between 27-40, indicating moderate stress; and 64% scored between 14-26, indicating high perceived stress.
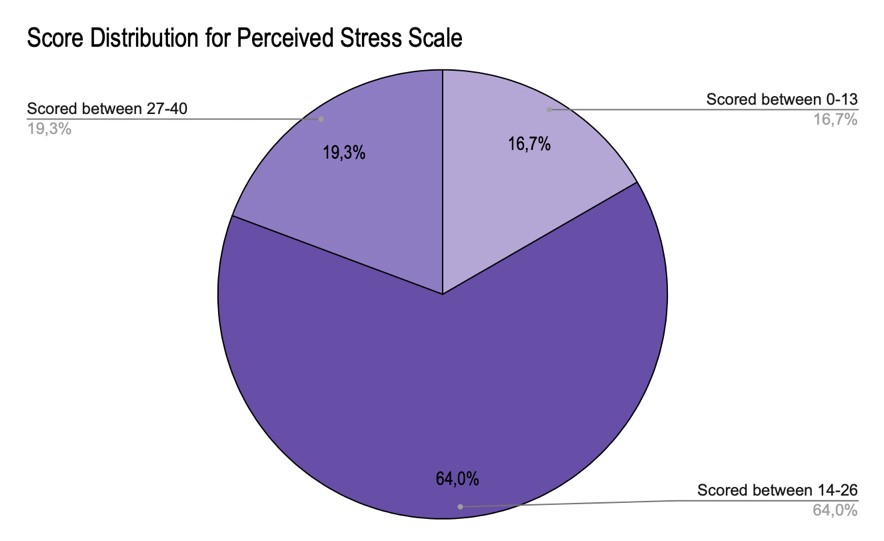
Figure 5: PSS Score Distribution
We see that 64% scored within the range of having moderate stress, and 19% scored within the range of high perceived stress. The high levels of stress signified in this participant indicate an increase in health implications.
Depression
Figure 6 represents the cumulative score distribution for the CES-D. Each participant’s results were calculated and entered to match the correlating score range. Of the responses received, 30.7% of participants scored between 0-15, indicating that the participant does not appear to be experiencing high levels of depressive symptoms at the current moment. About 22.8% of the participants scored between 16-21, indicating mild to moderate depression, and 26.5% of the participants scored over 21, suggesting the possibility of Major Depression.
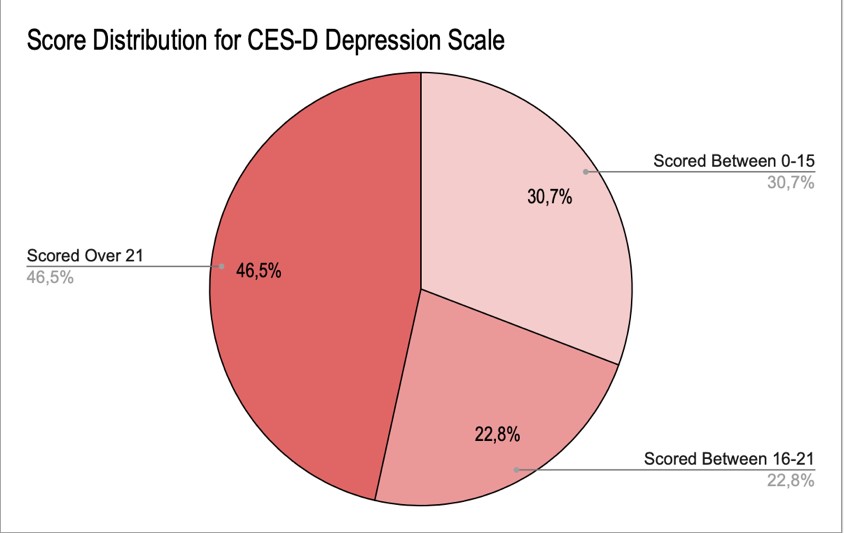
Figure 6: CES-D Score Distribution
The results of the Depression scale show that nearly half the sample participants, 46.5%, fall in the range of experiencing a high level of depressive symptoms associated with major depression. This statistic is extremely crucial due to the health implications of depression. The second substantial majority of participants, 30.7%, are not experiencing high depressive symptoms. This statistic is significant due to the high number of people being on the opposite end of the spectrum to the majority.
Alcohol Consumption
Figure 7 represents the cumulative score distribution for the AUDIT test. Each participant’s results were calculated and entered to match the correlating score range. Of the responses received, 80.7% of the participants scored between 0-7, indicating a low-risk alcohol consumption. Approximately 14.9% of the participants scored between 8-14, indicating hazardous or harmful alcohol consumption. About 4.4% of the participants scored 15 or more, indicating the likelihood of alcohol dependence.
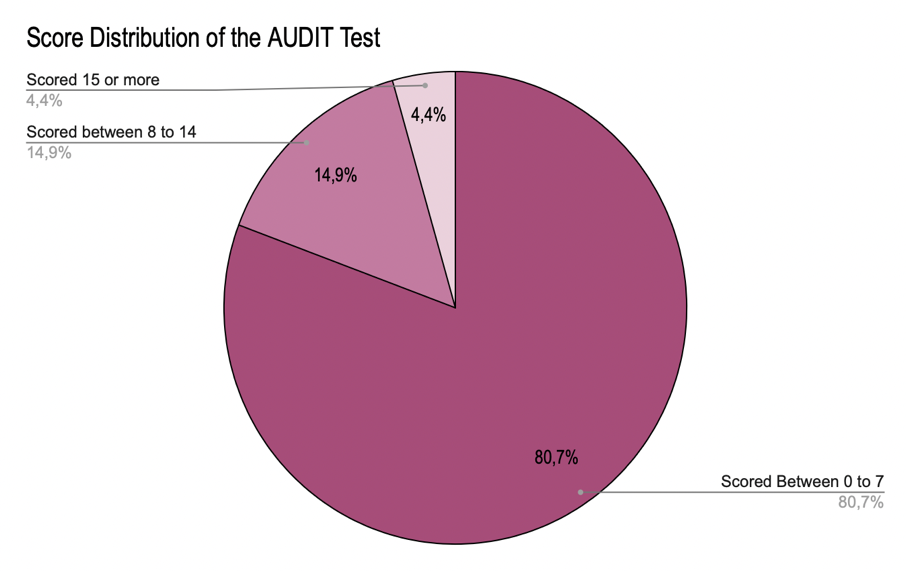
Figure 7: AUDIT Score Distribution
The results for the AUDIT test show that over 50% of the sample participants indicated having a low-risk alcohol consumption. Almost 15% indicated hazardous alcohol consumption, suggesting there should be some concern for the increase in alcohol use given this statistical backing.
Perfectionism
Figure 8 shows the cumulative score distribution for the APS-R. Each participant’s results were calculated and entered to match the correlating score range. Of the responses received, 97.4% of participants scored between 25-49, indicating perfectionism on the standard scale. Approximately 63.5% of the participants scored between 42-84, indicating perfectionism on the order scale. 89.6% of the participants scored between 14-24, which designates perfectionism on the discrepancy scale.
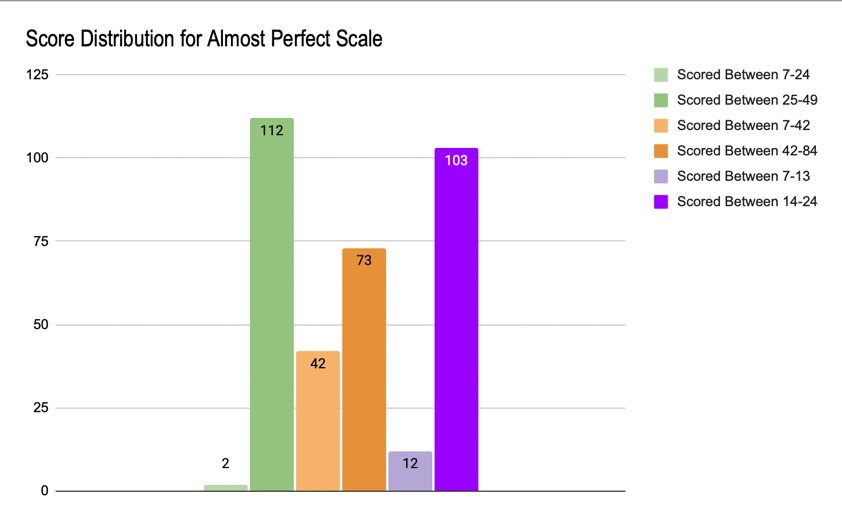
Figure 8: APS-R Score Distribution
The results of this test indicate that on all scales (standard, order, & discrepancy) there is a high level of perfectionism that can be observed among participants, the most being on the standard scale. This number is statistically significant, given the intense pressure associated with perfectionism.
Discussion
There is a visible correlation between increased anxiety, stress, and depression and that of high “perfectionism.” No correlation was found between lack of social support and depression/other measured mental health factors. A relationship was found to a slight increase in alcohol usage among those with increased anxiety, stress, depression, and perfectionist tendencies. We can conclude that among college first-years, there is an increase in the prevalence of moderate and severe anxiety, high perceived stress, and high level of depressive symptoms associated with major depression. Despite this staggering increase, 90% of participants reported not receiving psychological or mental services from their university, although 82.5% are willing to.
To counteract worsening mental health among undergraduate students, the university resources should be more accessible to students and target the critical issues reported in the survey. When asked, “what has been the most stressful part about your transition to college” the most common responses were workload, time management, making friends/networking, and being in a different environment. If the university-trained students on how to handle these common issues, it would make their transition to college less stressful.
References
Centers for Disease Control and Prevention. (2021, June 28). About mental health. www.cdc.gov/mentalhealth/learn/index.htm.
American Psychological Association. (n.d). Anxiety. www.apa.org/topics/anxiety.
Mayo Foundation for Medical Education and Research. (2022, October 14). Depression (major depressive disorder). Mayo clinic. www.mayoclinic.org/diseases-conditions/depression/symptoms-causes/syc-20356007
Downey, M. (2019, Jan 13). Why is student mental health at Georgia Tech and other schools worsening? The Atlanta Journal Constitution. https://www.ajc.com/blog/get-schooled/why-student-mental-health-georgia-tech-and-other-schools-worsening/nPgVz1SP7dFoElq7ye9b9J/
Scott, E. (2022, November 7). How is stress affecting my health? Verywell Mind. www.verywellmind.com/stress-and-health-3145086.
Jones, L. B., Judkowicz, C., Hudec, K. L., Munthali, R. J., Ana, P. P., Wang, A. Y., Munro, L., Xie, H., Pendakur, K., Rush, B., Gillett, J., Young, M., Singh, D., Todorova, A. A., Auerbach, R. P., Bruffaerts, R., Gildea, S. M., McKechnie, I., Gadermann, A., . . . Vigo, D. V. (2022, July 29). The world mental health international college student survey in Canada: Protocol for a mental health and substance use trend study. JMIR Research Protocols, 11(7)https://doi.org/10.2196/35168
Nelsen, S. K., Kayaalp, A., & Page, K. J. (2021, March 24). Perfectionism, substance use, and mental health in college students: A longitudinal analysis. Journal of American College Health, 71(1), 257-265. https://doi.org/10.1080/07448481.2021.1891076
Oswalt, S. B., Lederer, A. M., Chestnut-Steich, K., Day, C., Halbritter, A., & Ortiz, D. (2018, October 25). Trends in college students’ mental health diagnoses and utilization of services, 2009-2015. Journal of American College Health, 68(1), 41-51. https://doi.org/10.1080/07448481.2018.1515748
Richardson, T., Elliott, P., Roberts, R., & Jansen, M. (2016, July 29). A longitudinal study of financial difficulties and mental health in a national sample of British undergraduate students. Community Mental Health Journal, 53(3), 344-352. https://doi.org/10.1007/s10597-016-0052-0
Shaun, A., Schaus, J. F., & Deichen, M. (2016, September 18). The relationship of undergraduate major and housing with depression in undergraduate students. Cureus,8(9) https://doi.org/10.7759/cureus.786
Wang, C., Yan, S., Jiang, H., Guo, Y., Gan, Y., Lv, C., & Lu, Z. (2022, August 20). Socio-demographic characteristics, lifestyles, social support quality and mental health in college students: a cross-sectional study. BMC Public Health(22)1583. https://doi.org/10.1186/s12889-022-14002-1
